
Below is a description of the WQData website, hosted by NexSens Technology, and some basic functions for people to view and access data from the Susquehanna River Assessment. Thsee guidelines are organized by the major tabs that appear when you open the WQData website (see figure below).
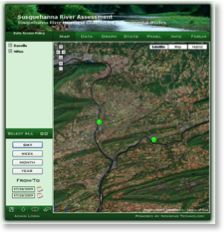
TAB #1 - SENSOR LOCATION MAP (opening screen)
The first page shows the locations of real-time water quality monitoring stations that are part of the Susquehanna River Assessment. The stations are the North Branch Susquehanna River in Danville and the West Branch Susquehanna River in Milton.
Scroll over the dots for each site to see the most recent water quality data recorded at that location (data are recorded every 5 minutes and uploaded to the website at the top of each hour).
Zoom in or out on the map to see other features of the landscape.
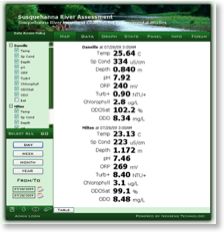
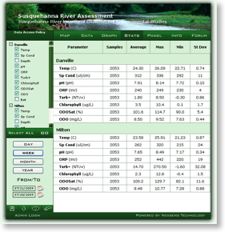
The “DATA” tab enables users to select which parameters to display and to view numerical data from the most recent upload or over a given time period in tabular form.
Selecting Parameters to Display
Parameters can be chosen for each site by clicking the check box in the window on the left or by clicking the “Select All” button and choosing the parameters to show from the available list. If you choose parameters from the “Select All” window, they will be displayed for both sites.
Displaying Single Observations vs. Multiple Observations Numerically
At the bottom of the data window, there is a button to toggle between “Table” or “Display” mode. “Display” mode is the default and shows you the most recent data for the parameters you chose. “Table” mode displays all observations of the selected parameters for the period of time you are choosing to display (daily, weekly, monthly, etc.). If you want to display data for a period of time in graph mode, see “GRAPH” section below.
Period of Record
Data are available from late afternoon on July 1 through the present day.
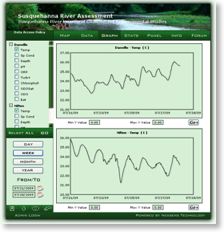
TAB# 3 - GRAPH
Seeing current data or tabular data records can be interesting, but patterns are often easier to see and compare using graphs of multiple parameters or sites. This tab enables users to display single parameters from single sites on a graph over some time period (daily, weekly, monthly, yearly).
Once you select parameters to show for each site in the “DATA” tab, you can click on the “GRAPH” tab and see these data displayed graphically. The software does not allow users to manipulate axes on the graphs and also does not allow multiple parameters or the same parameter from multiple sites to be displayed on the same graph.
The “STATS” tab shows basic statistics for each water quality parameter selected for each site over the time period chosen (daily, weekly, monthly, yearly). You can see the number of observations recorded over the time period, the average value, the maximum and minimum values, and the standard deviation.
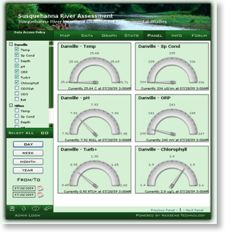
The “PANEL” window displays the most recent observed value for each selected parameter on a visual panel similar to a speedometer on a dashboard. The scale of each panel is based on the maximum and minimum observed values for each parameter in each site over the time period selected.
TAB# 6 - INFO
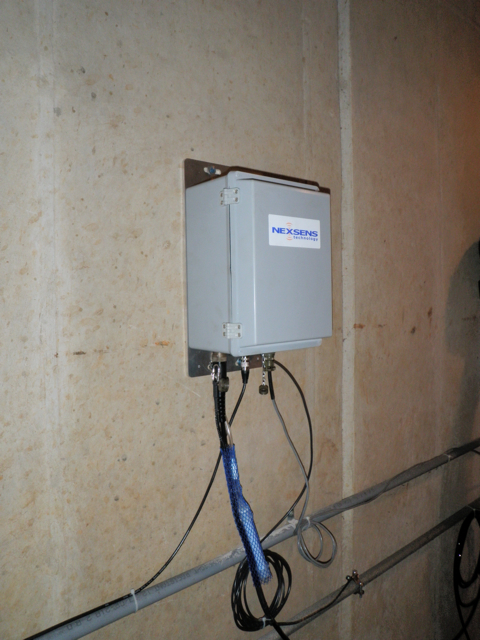
The “INFO” tab contains photographs of each site, general information about the equipment deployed at each site, who is responsible for maintaining the instruments, and the sources of funding for the instruments and equipment at each location.
TAB#7 - FORUM
This feature is currently not functional.
OTHER FUNCTION BUTTONS (at bottom left of each window)
In addition to the primary tabs, WQData comes with some features to allow each user to customize the website windows and to download data for personal or educational use.
“View user settings and save them to your computer” – enables users to see the settings for the website and to save them so that they remain the same the next time that person enters the WQData website on their computer and with the same internet browser software.
“Download the data displayed into Excel compatible format” – enables users to download selected data from the chosen time period (see “DATA” section above) in an Excel-compatible file (usually .csv). Users interested in downloading the data should read and comply with the Data Access Policy, which can be found via the link in the top left of the window in the WQData website.
“View data center skins, and change the one you are currently using” – enables users to change the background picture at the top of the WQData site to some other image provided by NexSens.
“Reset your user settings” – returns all customizable settings to their defaults, which are set by the website administrator (M. E. McTammany).
“Admin Login” – only accessible by project coordinator, Dr. Matthew E. McTammany, Biology Department, Bucknell University, Lewisburg, PA, 17837, mmctamma@bucknell.edu, 570-577-3975.